Top 10 Trading Indicators Every Crypto Trader Needs in 2026
FXDetails has put out a 2026-facing crypto indicator guide built around Ichimoku Cloud, ATR, Stochastic Oscillator and the usual momentum/volatility stack. The useful signal here is not the “top 10” framing. Lists are cheap.
Kyle Donnelly, Algorithmic Trader & Market Technician·updated July 11, 2026
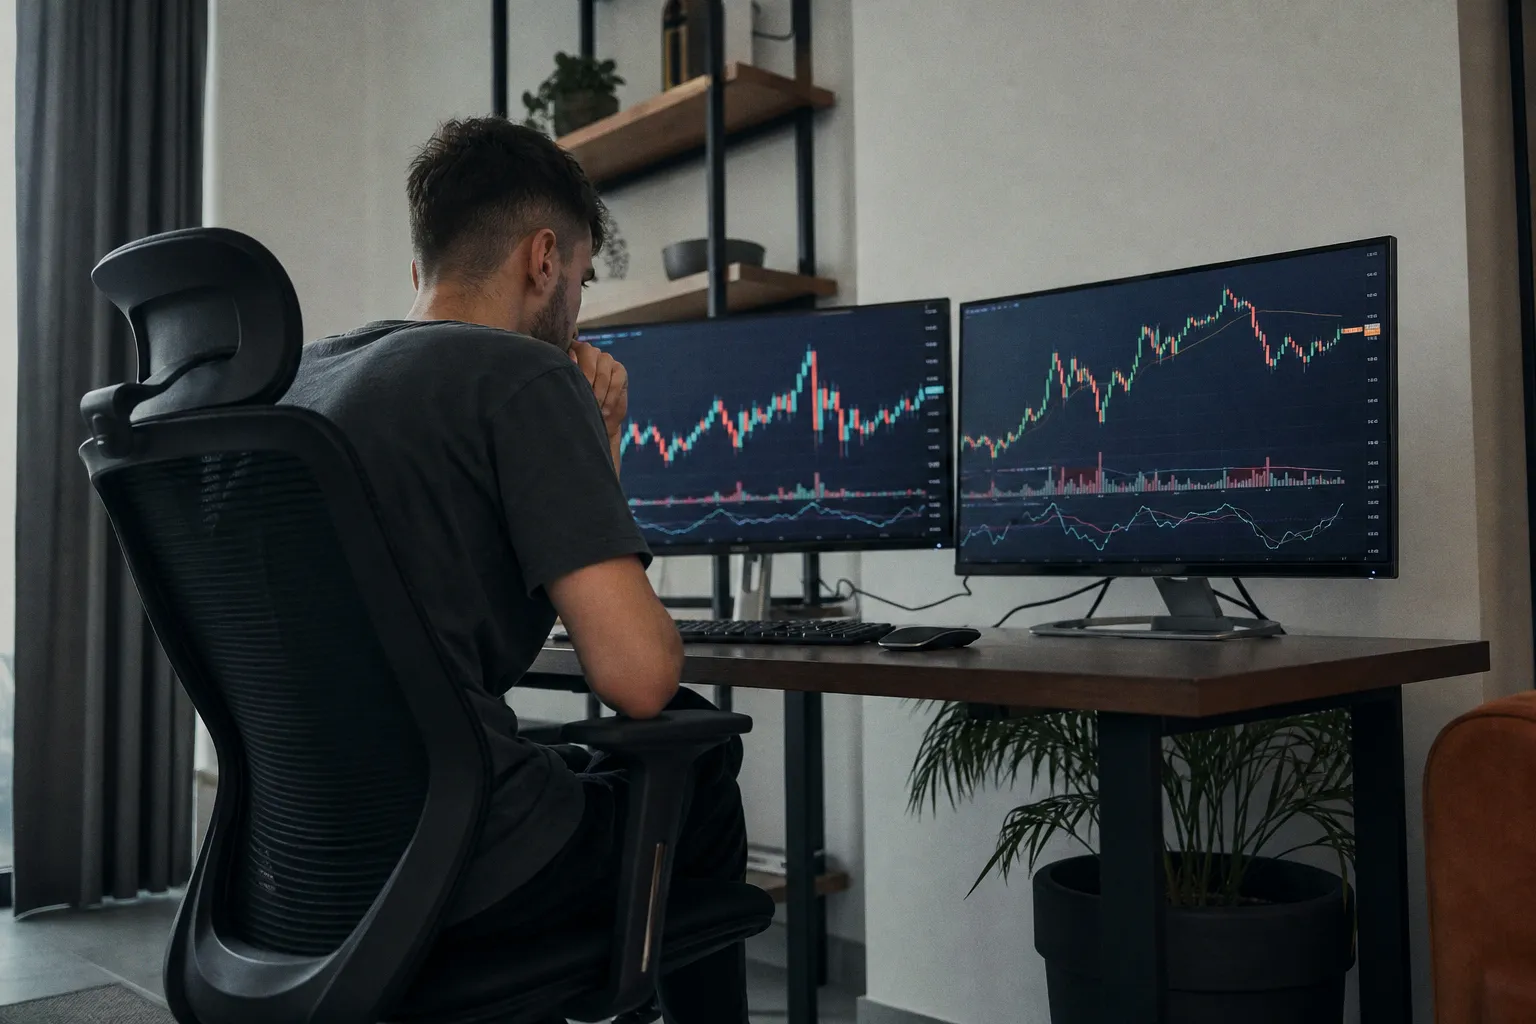
The indicator stack is getting more pragmatic
The guide frames crypto in 2026 as a more sophisticated market, with institutional adoption accelerating and round-the-clock trading keeping volatility persistent. That is a fair setup for the indicator set it highlights: RSI, MACD, Bollinger Bands, Volume Profile, Fibonacci levels, OBV, Ichimoku Cloud, ATR and Stochastic Oscillator.
I would not treat that as a magic menu. I would treat it as a classification map.
RSI and Stochastic sit in the momentum/mean-reversion bucket. MACD tries to blend trend and momentum through moving-average relationships. Bollinger Bands model volatility around a moving average. Volume Profile and OBV bring volume into the decision process. Ichimoku compresses trend, support/resistance and momentum into one chart structure. ATR does not predict direction at all, which is exactly why it is useful: it measures range and helps define stop distance and position sizing.
That last distinction matters. Traders keep asking indicators to do jobs they were not designed to do. ATR is not a long signal. RSI above 70 is not automatically a short. A Bollinger squeeze is not a guaranteed breakout. These are conditions, not trades.
Where the guide is useful — and where it gets dangerous
FXDetails notes that RSI readings above 70 are commonly treated as overbought and below 30 as oversold, while some crypto traders shorten the classic 14-period setting to 9 or 11 for faster signals. That is plausible as a tactical adjustment, but faster is not the same as better. Faster usually means more signals, more whipsaw, and a higher requirement for filtering.
The same applies to MACD crossovers. A bullish crossover — MACD line above the signal line — can help in trending markets, and the source specifically points to Bitcoin and Ethereum in that context. But crossovers in chop are a drawdown machine. You need regime detection, or at least confluence with trend structure and volatility state.
Bollinger Bands are described through the standard three-line structure: a middle moving average and upper/lower bands set around two standard deviations. The squeeze concept is useful because it identifies compressed volatility. The “bounce” idea — buying near the lower band and selling near the upper band — is more fragile. It assumes range behavior. In expansion phases, that logic can become a clean way to fade strength and catch losses.
Volume Profile is more interesting for crypto now because it maps activity across price levels rather than time and identifies the Point of Control, the level with the highest volume. The guide argues that growing institutional volume makes it increasingly reliable. I would phrase that more cautiously: it may be more informative when real participation clusters around levels, but every profile still depends on timeframe, venue and data quality.
What I would actually test before using this in 2026
The actionable part is not memorizing ten indicators. It is building a small matrix and testing whether each tool adds independent information.
RSI divergence, for example, is mentioned as a reversal signal when price makes new highs but RSI fails to confirm. Fine. Test it across assets, regimes and holding periods. Then test it again after transaction costs. Most “powerful” divergences lose their shine when sample size increases.
OBV divergence has a similar logic: if price rises while OBV falls, the move may be weaker than it looks. That is a hypothesis, not a conclusion. It needs validation against false breakouts, continuation moves and liquidity conditions.
Fibonacci levels — 23.6%, 38.2%, 50%, 61.8% and 78.6% — are presented as support and resistance zones, with the 61.8% level singled out for pullback entries. I am more cynical here. Fibonacci can be useful as a shared reference point, but it is easy to curve-fit after the fact. If it works in your system, the edge should survive objective rules.
Ichimoku is probably the most visually dense tool in the set. Price above the cloud is described as bullish; below it, bearish. Cloud thickness is treated as support/resistance strength. That can help swing traders avoid some low-quality countertrend entries, but again, the output must be reduced to testable rules.
My baseline takeaway: use ATR for risk normalization, Volume Profile for level context, and momentum tools only with regime filters. Everything else earns a slot only if it improves expectancy without inflating drawdown. Indicators do not create edge by existing on a chart. They create edge only when they reduce uncertainty better than random noise.