Kyle Donnelly, Algorithmic Trader & Market Technician
July 22, 2026 · 11 min read
Is the best beginner trading platform bad for charting?
Robinhood Legend can display eight charts in one window and more than 80 indicators. eToro’s web platform exposes 104 indicators through its TradingView integration.
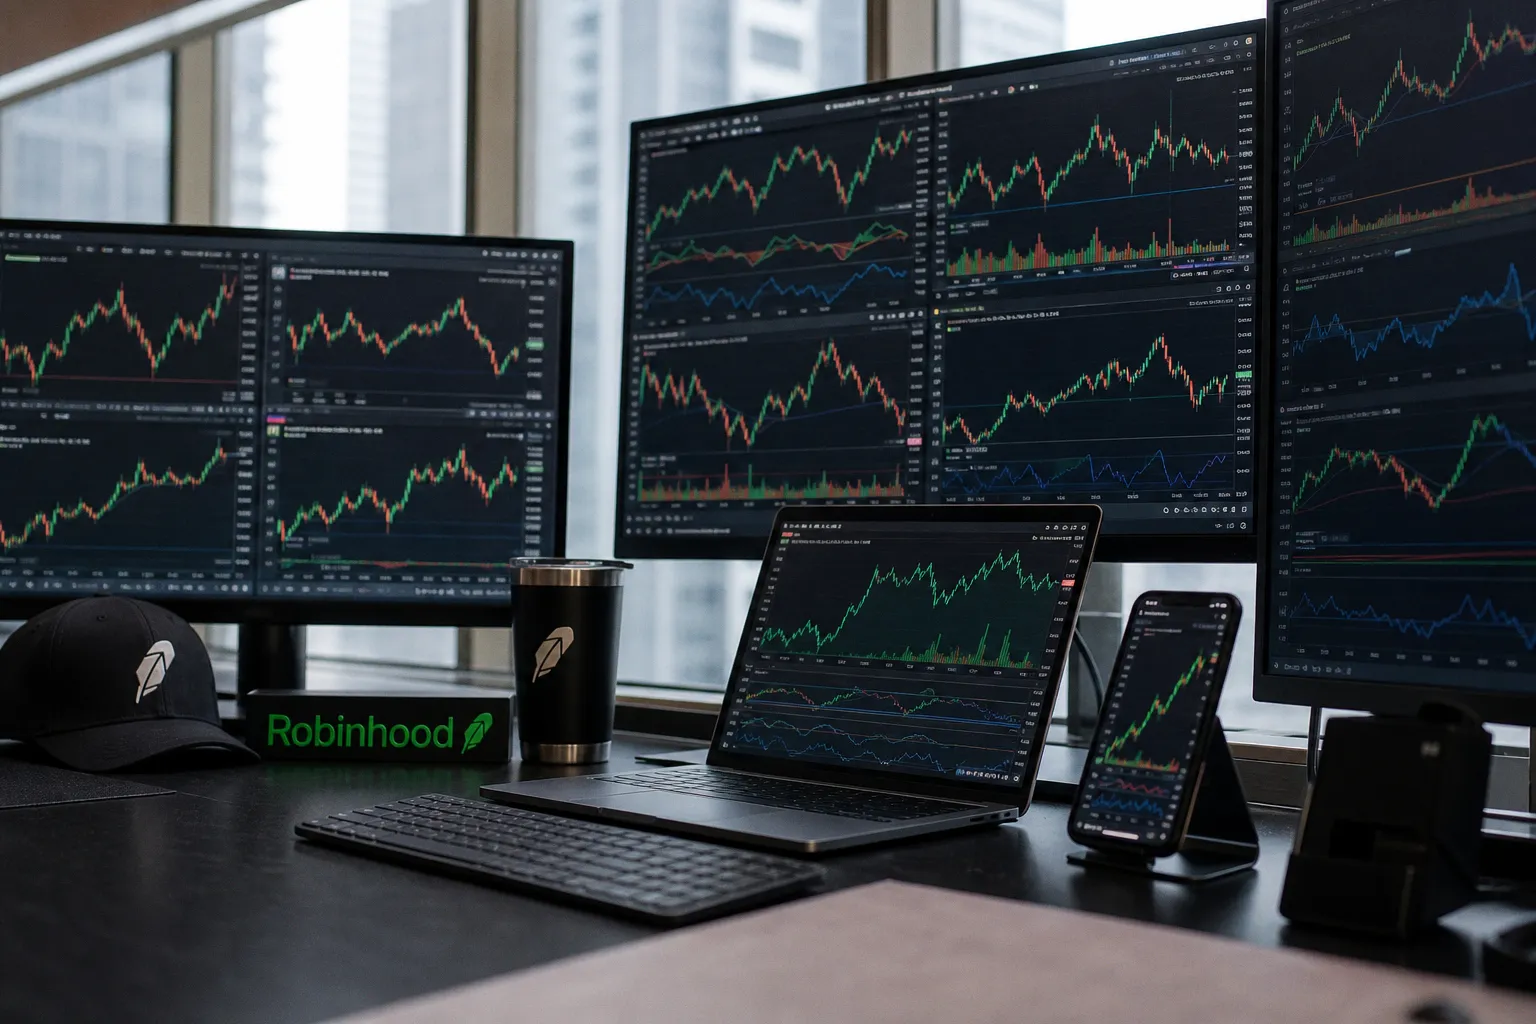
On the surface, that ends an old argument: beginner brokers no longer offer toy charts.
It does not end the useful argument.
The best beginner trading platform is usually built to reduce friction between opening an account, placing an order, and checking a position. That is a valid product decision. But technical analysis is not a collection of indicators. It is a process: inspect context, define a condition, test it over a sample, execute it consistently, and measure drawdown when the condition fails. Retail platforms have improved sharply at the first step. The rest remains uneven.
I have no objection to simple broker interfaces. Most platforms should remove clutter. But “simple” becomes a problem when it hides the mechanics that determine whether a signal has an edge or is just chart noise with a clean color palette.
Retail charting is no longer primitive. It is still constrained.
For years, the charting stack at beginner brokers was painfully thin: a few moving averages, a basic RSI, limited timeframes, and enough drawing functionality to convince a new trader that diagonal lines were a methodology.
Robinhood Legend changed that baseline when it launched in October 2024. Eight simultaneous charts is not a cosmetic upgrade. For a trader working across a watchlist, that layout can support a legitimate top-down workflow: daily structure, intraday execution chart, sector proxy, broad index, volatility reference, and correlated instrument all visible at once. You stop tabbing between isolated snapshots and start seeing confluence.
More than 80 indicators is also enough for almost every conventional technical workflow. Nobody needs 400 indicators. A strategy with 400 possible inputs is usually an overfitting machine looking for historical coincidence.
The issue is not indicator count. It is whether the platform lets you turn an idea into a repeatable rule.
| Platform | What the charting upgrade gets right | Where the workflow breaks |
|---|---|---|
| Robinhood Legend | Up to 8 charts in one workspace; 80+ indicators; desktop-oriented charting | No built-in paper trading; no conventional scripting environment |
| eToro web | TradingView-powered charts with 104 indicators | The mobile workflow is materially restricted |
| Webull | More developed retail charting and simulated trading compared with Robinhood Legend | Default data setup may not show the full NBBO picture without the relevant subscription |
| thinkorswim | Deeper simulation and customization workflow | More operational complexity than a beginner may actually need |
That distinction matters because a chart is not a dashboard. It is an input layer. If the platform cannot support validation, automation, or clean data interpretation, the visual upgrade has a hard ceiling.
A platform can offer 100 indicators and still leave the trader with zero tested signals.
The retail misconception is predictable: more indicators means more analysis. In practice, it often means more correlated inputs measuring the same price behavior with different smoothing formulas. MACD, moving-average crossovers, and trend filters are not independent votes merely because they occupy different panels. Treating them as independent creates false confluence.
Robinhood Legend is a better charting platform than the old Robinhood experience. That is true. It is not automatically a better research platform.
Robinhood Legend has the screen real estate, not the full laboratory
I like the direction of Legend. A browser-based desktop terminal with multi-chart support addresses a real defect in beginner trading platforms: the assumption that every decision should be made from a phone-sized rectangle.
But the missing paper-trading environment is not a small omission. It is the main omission.
As of 2026, Robinhood Legend does not include a built-in paper trading simulator. Webull and thinkorswim do. That does not mean paper trading perfectly models live execution; it does not. Simulated fills can be generous, latency can be abstracted away, and a trader with no capital at risk often behaves differently. Still, paper trading is where a beginner should discover that their “high-probability setup” has a 42% win rate and a larger average loss than they expected.
Without a simulator, the typical user jumps from observation to live exposure. That is a bad sequence.
A proper workflow for beginner charting software should look something like this:
1. Define the setup in falsifiable terms. “Buy strong stocks” is not a setup. “Enter after a daily close above the 20-day high when relative volume exceeds a defined threshold” is at least testable.
2. Collect a meaningful sample. Ten trades prove nothing. Fifty trades may reveal a problem. One hundred begins to give the distribution some shape, depending on the strategy’s frequency and market regime.
3. Separate signal quality from execution quality. A valid entry can still lose money through poor stops, spreads, position sizing, or a poor fill assumption.
4. Measure drawdown, not just win rate. A 70% win-rate strategy that periodically gives back six months of gains is not automatically superior to a 45% win-rate trend system with positive expectancy.
5. Only then trade small. Live capital is the final test, not the first backtest.
This is why I do not accept “it has RSI and Bollinger Bands” as a serious answer to whether a platform supports technical analysis. That is feature-list thinking. The relevant question is whether the platform supports a closed research loop.
Legend’s lack of traditional scripting is the second constraint. There is no Pine Script-style environment and no thinkScript equivalent where a trader can write, inspect, version, and stress-test a custom condition directly. In September 2025, Robinhood announced Cortex AI, positioned as a way to build custom indicators through natural-language prompts.
That could be useful. It could also create a new layer of opacity.
Natural-language indicator construction lowers the barrier to experimentation. Fine. But a trader still needs to know what formula was produced, how it handles missing data, whether it repaints, what timeframe it references, and whether its logic has been tested outside the period that inspired the prompt. “Build me an indicator that catches reversals” is not analysis. It is an invitation to data mine.
AI can reduce coding friction. It cannot manufacture an edge from an underspecified idea.
eToro’s TradingView integration is real, but the mobile gap is not trivial
eToro upgraded its web charting in March 2023 through a TradingView partnership. On the web platform, users gained access to 104 indicators. That is a major improvement over the standard broker-chart template and enough for a broad range of discretionary work.
For web-based charting, the integration solves much of the beginner problem. A trader can use familiar indicators, inspect multiple timeframes, and work with a more capable visual environment without immediately needing a separate charting subscription.
The catch appears when the user shifts to mobile.
eToro’s mobile app provides only nine timeframe options, ranging from one minute to weekly. There are no sub-minute intervals and no monthly timeframe. More importantly, it does not provide drawing tools on mobile. No trendlines. No anchored levels. No clean annotation workflow. No practical way to mark the range that defines the trade you are considering.
That sounds like a minor limitation until you observe how beginners actually trade. They do not build a complete plan at a desktop, record the invalidation level, and then use the mobile app only for execution. They see a chart move on a phone, pinch-zoom into a five-minute candle, add an oscillator, and make a decision from an incomplete frame.
The platform has then made analysis easier to access but harder to discipline.
A mobile terminal does not need every desktop feature. It does need enough structure to prevent false precision. If you cannot draw the support level, compare the relevant higher timeframe, or inspect a monthly reference range, the chart is not giving you a simplified workflow. It is giving you a cropped workflow.
Convenience is not the same thing as analytical completeness. On mobile, those two are routinely confused.
This does not make eToro unusable. It means the web platform should be the research terminal, while the mobile app should be treated as a monitoring and execution layer. That division of labor is boring. It is also much safer than pretending a stripped-down mobile chart is a full technical workstation.
And yes, screen allocation matters. If one display is devoted to a platform and another is occupied by a streaming guide for the evening, do not pretend that a phone chart can replace the missing research screen. It cannot.
The Webull data question is more important than its indicator menu
Webull sits closer to a proper retail trading terminal than most easy trading platforms. It has a more developed charting environment, and its paper-trading capability gives beginners a place to test process before risking capital.
But the data feed issue deserves more attention than it gets.
Webull uses Nasdaq-sourced data by default. Traders who do not subscribe to NBBO data may not be seeing the complete National Best Bid and Offer picture. That matters because quoted prices are not decorative. They are the state variables from which your spread assumptions, entry triggers, stop logic, and apparent liquidity are derived.
For a slow swing trader using daily charts, the practical impact may be limited. For an active trader who thinks a one- or two-cent difference is irrelevant, the answer depends on instrument, volatility, order type, and frequency. Repeated small execution errors compound. A strategy that looks marginally positive in a backtest can become negative after realistic spread and fill assumptions.
This is the part beginners routinely miss: charting quality is not just candle quality.
A clean candlestick chart can still sit on top of incomplete quote context. An indicator can calculate correctly from the data it receives while the data itself fails to represent the full market picture you think you are trading. The math is internally consistent. The premise is not.
I would rather use five indicators on a clean, understood feed than 150 indicators on a platform whose quote construction I have not examined.
AI customization will not replace scripting until it becomes inspectable
The migration from code-based customization to prompt-driven customization is inevitable. It will pull more people into indicator design, and that is not inherently bad. Pine Script did the same thing for a previous generation of retail traders: it made experimentation cheap.
Cheap experimentation has a downside. It produces a lot of accidental curve fitting.
Traditional scripting imposes friction. You need to state the condition, use the correct series, define the lookback, decide what happens at session boundaries, and confront the actual logic. That friction is productive. It exposes vague thinking.
Prompt-based tools remove some of that resistance. Good. But the platform must return more than a line on a chart. It should return understandable logic, visible parameters, historical behavior across regimes, and a way to test the indicator without sending a live order.
Until then, Cortex-style customization should be treated as a prototyping interface, not a signal authority.
Here is the blunt version: if you cannot explain why the indicator fired, you cannot evaluate why it failed.
The market does not care whether the condition was generated in Python, Pine Script, a visual builder, or a natural-language prompt. Your P&L will reflect the same things it always has: expectancy, position sizing, execution costs, regime dependence, and the size of the drawdown you can actually tolerate.
The beginner platform is often good enough—if you define “enough” correctly
The best beginner trading platform is not necessarily bad for charting in 2026. That conclusion is too lazy. Robinhood Legend is a meaningful upgrade. eToro’s web charts are materially stronger because of TradingView. Webull offers a more complete path for traders who want to simulate and iterate.
But each platform has a boundary that marketing language tends to blur.
Robinhood Legend is capable for observation and basic multi-chart analysis, yet weak where a systematic trader needs paper validation and transparent customization. eToro’s web experience is credible, while its mobile charting is constrained enough that it should not be mistaken for a full analytical environment. Webull offers a stronger research loop, but traders need to understand what data they are actually viewing.
That is the useful framework. Not “which platform has the most indicators?” Not “which interface feels easiest?” Those are low-resolution questions.
Ask whether the platform lets you do four things without distortion: see the market context, define a rule, test a sample, and execute with data you understand. If it fails one of those steps, build around the gap. Use the broker for orders. Use a dedicated charting platform for analysis. Use simulation or external tracking for validation.
A simple broker interface is a feature. Treating it as a complete trading system is the bug.