Kyle Donnelly, Algorithmic Trader & Market Technician
July 24, 2026 · 14 min read
Best stock trading platform: why retail giants fail chartists
A platform can claim 0.04-second order execution and still be structurally unfit for an active chartist. Fidelity’s quoted execution speed is one data point.
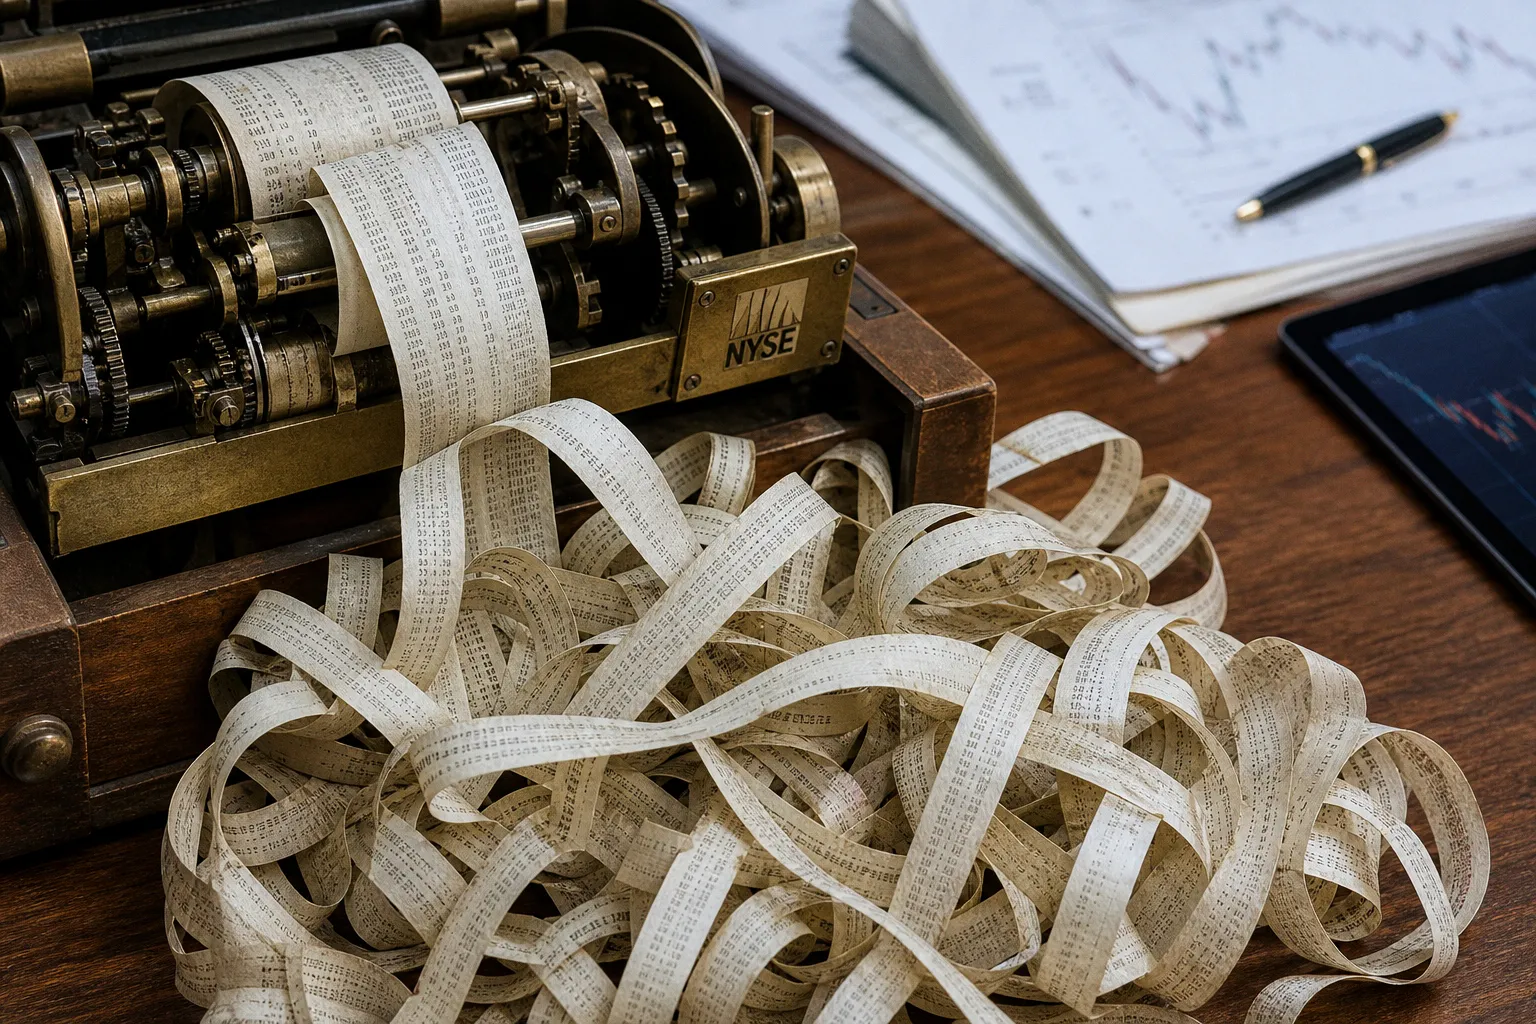
If the position window takes more than two seconds to reflect a fill, the trader is operating with a broken state model. The order may be live. The chart may look clean. But the interface is feeding stale information back to the person making the next decision.
That is not a cosmetic defect. It changes risk.
The search for the best stock trading platform usually starts in the wrong place. Traders compare commission schedules, count indicators, and ask whether a broker has options chains or fractional shares. Those are valid features. They are not the bottleneck for a technical workflow.
The real question is harsher: can the platform preserve the integrity of the signal from chart to order to position management?
For a long-term investor placing a few orders per quarter, most major retail brokers are perfectly serviceable. For someone trading intraday momentum, mean-reversion baskets, or systematic breakouts across multiple names, the broker’s native workstation often becomes the weakest link in the stack. The issue is not that these platforms have no charts. The issue is that their charts, alerts, scripting environments, and execution interfaces were not designed around a short feedback loop.
I have tested enough broker platforms to stop treating “all-in-one” as a compliment. In trading software, it often means every component is adequate and none of them is reliable under pressure.
The latency trap is not just about order execution
Retail platforms love publishing execution statistics because the number is easy to market. A fraction of a second looks impressive in a banner. But execution latency is only one segment of the workflow.
The relevant chain is longer:
1. Market data reaches the chart.
2. The chart renders the current state.
3. Your indicator or scanner identifies a condition.
4. You submit an order.
5. The broker acknowledges and fills it.
6. The platform updates the position, average price, buying power, stop order, and realized or unrealized P&L.
7. You decide whether the original thesis still exists.
If any link lags, the entire decision process acquires noise.
Fidelity’s Active Trader Pro is a good example of why this distinction matters. The platform can be useful for research, portfolio monitoring, and less time-sensitive execution. But it does not offer sub-one-minute chart intervals such as 10-second or 15-second bars. Users have also reported position updates taking more than two seconds after a trade. On a daily chart, two seconds is irrelevant. On a fast intraday setup, it is a meaningful fraction of the trade’s lifespan.
A two-second discrepancy creates three avoidable errors:
- You can submit a duplicate order because the platform has not reflected the first fill.
- You can size the next order off obsolete buying power or an incorrect current position.
- You can manage a stop as though you are flat, partially filled, or fully exposed when the account state says otherwise.
This is why I separate market latency from interface latency. The first is a market-structure problem. The second is a software-design problem. A retail trader rarely controls either one completely, but they should at least know which problem they are paying for.
A fast fill displayed slowly is not a fast workflow. It is delayed risk disclosure.
The same principle applies to alerts. Traditional broker desktop applications often run alerts locally. Close the application, lose the alert. That architecture was acceptable when trading platforms were desktop-bound. It is a poor fit for a trader whose signals need to persist through a laptop restart, an internet interruption, or a move between devices.
Cloud-based alerting changes the operational model. A platform such as TradingView can monitor an alert condition continuously without requiring the desktop client to remain open. That does not improve the underlying edge. It does reduce operational failure. Those are different things, and traders routinely confuse them.
No platform can manufacture an edge from a weak strategy. But a platform can absolutely erase a real edge through stale data, missing alerts, inconsistent chart behavior, and execution friction.
Stock charting software limitations are usually architectural
Most broker platforms carry the expected toolbox: moving averages, RSI, MACD, Bollinger Bands, volume, maybe a few drawing tools. That is enough to put colored lines over price. It is not enough to construct, test, and monitor a repeatable technical process.
The retail misconception is that indicator count equals analytical depth. It does not.
Robinhood Legend illustrates the distinction. Its desktop platform, launched in October 2024, brought a more serious charting interface than the original Robinhood experience. It includes more than 90 indicators and volume profile. That is a real improvement, not something to dismiss. But the platform still constrains the trader in places that matter more than an extra oscillator.
Its custom scan widgets through Robinhood Cortex are limited to 100 queries per day. More importantly, users cannot set alerts directly while charting. That is an odd limitation in a platform marketed toward active traders. A chart without alert creation is a dashboard. It is not a monitoring system.
The limitation becomes obvious when you run a multi-symbol process. Suppose I am tracking a universe of liquid stocks for a volatility contraction followed by relative-volume expansion and a reclaim of intraday VWAP. I do not want to manually revisit 40 charts every few minutes. That workflow is not analysis. It is repetitive labor with a high error rate.
I need persistent conditions, parameter control, and a way to distinguish a genuine setup from a one-bar anomaly.
TradingView has more than 400 built-in indicators and over 100,000 community-built Pine Script studies. The raw number is not the point. Most community scripts are redundant, poorly documented, overfit, or functionally identical to another script with a more dramatic name. The platform’s advantage is the programmable layer.
Pine Script lets the user turn an idea into explicit conditions:
- define the lookback window;
- specify whether volume is relative to the same time of day or a rolling average;
- control session boundaries;
- filter by trend regime or volatility regime;
- create alerts from the actual logic rather than from a visual approximation;
- test how the signal behaves across a meaningful sample size.
That is the difference between “RSI is below 30” and “RSI is below 30 after a statistically abnormal range expansion, while price remains above a rising higher-timeframe average and relative volume has normalized.” The first is a retail trigger. The second is at least an attempt to define context.
I am not claiming every trader needs to write Pine Script. Many do not. But technical traders need a platform that allows their logic to become more precise over time. Static broker indicators force the process in the opposite direction: adapt the strategy to the platform’s defaults.
That is backwards.
| Platform layer | Typical retail broker charting | Dedicated charting environment |
|---|---|---|
| Timeframes | Often limited, sometimes no sub-minute granularity | Broad intraday and higher-timeframe coverage |
| Indicator logic | Fixed library with limited parameters | Built-ins plus custom scripts and user-defined conditions |
| Alerts | Frequently tied to a desktop session or limited workflows | Cloud-based, persistent, condition-driven alerts |
| Scanning | Preset filters or usage caps | Custom screeners, watchlists, script-based logic |
| Chart annotation | Functional but usually shallow | Flexible drawings, layouts, templates, and cross-device persistence |
| Strategy iteration | Manual observation dominates | Faster testing, refinement, and alert deployment |
Thinkorswim remains the benchmark exception among traditional broker platforms. It has earned that reputation. The platform is serious, its options tooling is deep, and it offers more analytical range than the average broker terminal. But even there, the trade-offs are visible. Its drawing tools do not match TradingView’s depth or flexibility, and its guest access is limited to a 30-day trial unless you open a Charles Schwab account.
That does not make thinkorswim bad. It makes it specialized. A best broker for charting does not automatically provide the best charting environment. Those are separate product categories, even when the industry insists on bundling them together.
Integrated execution creates friction where it should remove it
The argument for trading directly from a broker’s chart is obvious: fewer windows, fewer clicks, fewer chances to make a manual error. In theory, integration reduces friction.
In practice, many native broker interfaces create a different kind of friction. They force chart analysis, order entry, and position management into a single interface that is not excellent at any of the three.
Interactive Brokers is an instructive case. IBKR has broad market access, sophisticated order-routing capability, and a level of account control that many active traders need. Those are material strengths. But users have criticized the newer IBKR Desktop platform for not allowing limit orders to be created directly from the long/short position tool. Users have also flagged the absence of visible stop-loss and take-profit locations directly on the chart.
That sounds minor until you map it to execution behavior.
If I establish a position from a chart, I want the chart to remain the authoritative visual record of that position: entry, size, stop, target, and working orders. If stops and targets are hidden in a separate ticket or an account panel, then I am forced to reconcile two states manually. The more volatile the instrument, the less acceptable that becomes.
The same problem appears in order modification. A platform can technically support bracket orders while making them awkward to inspect, drag, adjust, or cancel. The feature exists. The workflow fails.
This is where a hybrid stack usually wins. I use the charting platform for signal generation, visual context, and alert logic. I use the broker for what the broker should do: custody, routing, margin, account controls, and execution. Connecting the two does not remove all risk. It makes the responsibilities cleaner.
For example, trading through TradingView with Interactive Brokers requires active accounts at both firms. Traders also need at least $500 in the IBKR account, plus the relevant subscriptions, to receive real-time market data through that setup. This is not frictionless. It is an explicit cost.
But explicit cost is preferable to hidden cost.
The hidden cost is trading from a chart that cannot express your setup, receiving alerts only when a local application happens to be open, or managing orders from a position display that lags the underlying account.
Convenience is not the same as integration. A clean workflow keeps analysis and execution synchronized; a bad one merely puts them on the same screen.
The post-PDT environment changes buying power, not software quality
The Pattern Day Trader framework changed in June 2026. The old $25,000 minimum-equity requirement and end-of-day-based day-trading buying-power calculations were replaced by real-time intraday margin excess calculations for margin clients.
That is a meaningful structural change. It reduces one of the most artificial constraints in the old retail day-trading framework. It also makes real-time account-state accuracy more important, not less.
Under an end-of-day model, traders could at least think in coarse buckets. Under real-time intraday margin excess, the platform’s representation of margin, open exposure, and available capacity becomes part of the live decision loop. If the interface is slow, opaque, or inconsistent, the trader may not understand the account’s actual constraints until the broker rejects an order or forces a change in behavior.
The new framework did not eliminate margin requirements. It changed the calculation method. That distinction matters because traders tend to hear “PDT reform” and translate it into “more freedom.” What they actually receive is a more dynamic risk environment.
Dynamic systems reward accurate state tracking. They punish assumptions.
For platform selection, this means the old retail-broker pitch — one account, one desktop app, one simplified display — becomes less persuasive for active traders. Simplicity is useful only if it does not hide relevant variables.
A serious platform setup should let you see, with minimal ambiguity:
- current position size and average entry;
- working orders and their exact price locations;
- realized and unrealized P&L separately;
- buying power or intraday margin excess as it changes;
- whether market data is real-time or delayed;
- whether an alert is running in the cloud, locally, or not at all.
If the answer to any of those requires opening three panels and guessing which one has refreshed most recently, the platform is not ready for a fast decision cycle.
Why the “one platform” dream keeps failing
Traders want a single terminal because context switching has a cost. They are right about that. Every extra tab, login, and manual copy operation adds failure points.
But one platform can only be superior if it is genuinely strong at all layers: charting, scanning, scripting, alerting, execution, order management, and account reporting. Most retail brokers are not built that way. They are brokerage businesses first. Their platform is designed to retain customers, support broad product access, and keep the average user inside the ecosystem.
That business model produces predictable compromises:
1. The chart engine is conservative. Broker platforms prioritize stability and compliance over rapid iteration in drawing tools, indicators, and custom logic.
2. Customization is bounded. Open scripting can create support complexity, performance issues, and compliance headaches. Brokers therefore tend to provide a static indicator library.
3. Alerts are treated as a feature, not infrastructure. A serious technical workflow treats alerts as persistent signal delivery. Many broker platforms treat them as notifications.
4. Execution design favors general usability. The interface is built for stocks, ETFs, options, mutual funds, retirement accounts, and occasional traders. It is not optimized around the specific needs of an intraday chartist.
5. The data model is fragmented. Chart data, order data, account data, and position data may update through different processes. That creates the stale-state problem.
None of this means that every trader should abandon a retail broker platform. If you trade weekly charts, use a small set of indicators, and place occasional limit orders, Fidelity, Schwab, Robinhood, or another major broker may be all you need. The best stock trading platform is not the platform with the most features. It is the one whose failure modes do not intersect with your holding period.
That is the test.
A swing trader can tolerate a clumsy bracket-order interface more easily than a scalper. A systematic trader can tolerate a separate execution window if alerts and chart logic are reliable. An options trader may accept weaker drawing tools in exchange for superior options analytics. There is no universal winner because there is no universal trading process.
There are, however, universal failure modes: stale information, untestable logic, unreliable alerts, and hidden order state.
Build the stack around the signal, not the brand
When I evaluate trading platforms for technical analysis, I start with the signal’s lifecycle. Not the platform’s marketing page.
A sensible stack can be surprisingly simple:
- Charting and research: a platform with stable multi-timeframe charts, programmable conditions, and cloud alerts.
- Execution: a broker with the markets, order types, account structure, and data subscriptions required by the strategy.
- Risk control: visible stops, targets, buying power, and position state that can be reconciled immediately.
- Review: exports, screenshots, or journaling data that allow the trader to measure expectancy, drawdown, and rule adherence.
The platform should reduce noise. It should not become another source of it.
I am skeptical whenever a broker announces another batch of indicators. Ninety indicators do not solve an alerting problem. Four hundred indicators do not solve an execution problem. A hundred thousand community scripts do not solve a trader’s lack of sample size or discipline.
Tools are leverage, not salvation.
The retail giants still have their place. They are often strong custodians, reasonable execution venues, and useful research providers. But chartists should stop expecting them to become specialized analytical environments simply because they have added darker charts and more panels.
The market does not care whether the interface feels polished. It only responds to order flow, liquidity, volatility, and time. Your software needs to represent those conditions accurately enough for your strategy to survive contact with them.
That is the standard. Everything else is UI.